01The Today tab
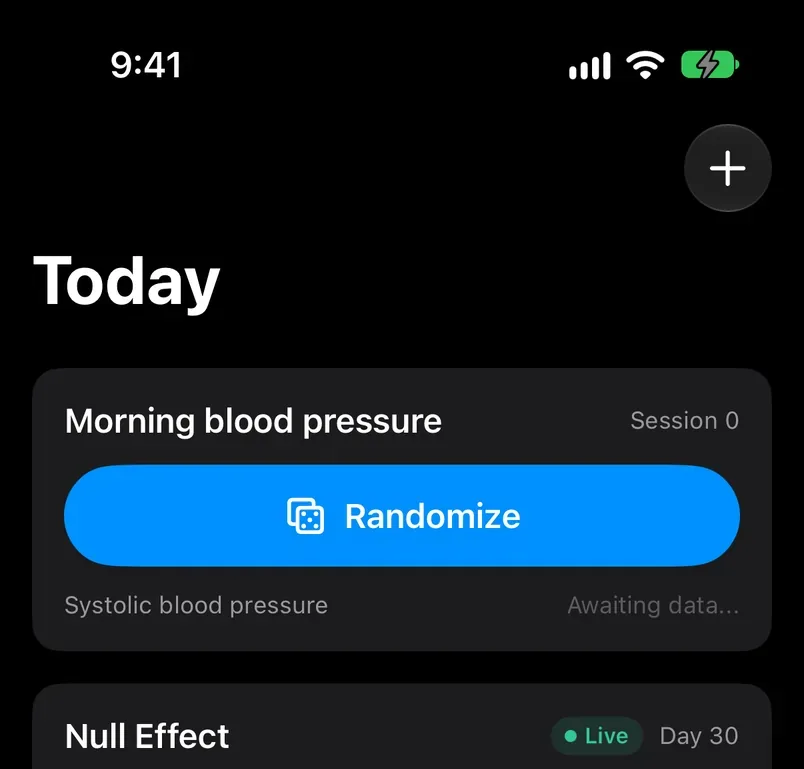
The Today tab is the home screen. It lists every running experiment as a card and tells you what the app needs from you right now. Most of the time that is nothing, or one tap.
 1
2
3
4
- 1The experiment card. One card per running experiment, headed by its name. Finished and stopped experiments live in the Experiments tab, not here. The third tab, Settings, holds Health access, iCloud sync and export.
- 2The unit counter. How many units have been randomized so far, labelled by the unit kind: Night 12, Day 5, Workout 3, Session 8. The label follows the kind you chose at setup.
- 3Randomize. A unit begins only when you tap this. ABMe draws the condition from a seeded fair coin flip at that moment. You cannot see or choose the outcome in advance, and until you tap, no unit is running and nothing is measured.
- 4The primary metric and its state. What the card is tracking and where the last unit stands: awaiting data, a value, or the current estimate once both arms have one.
 1
2
3
4
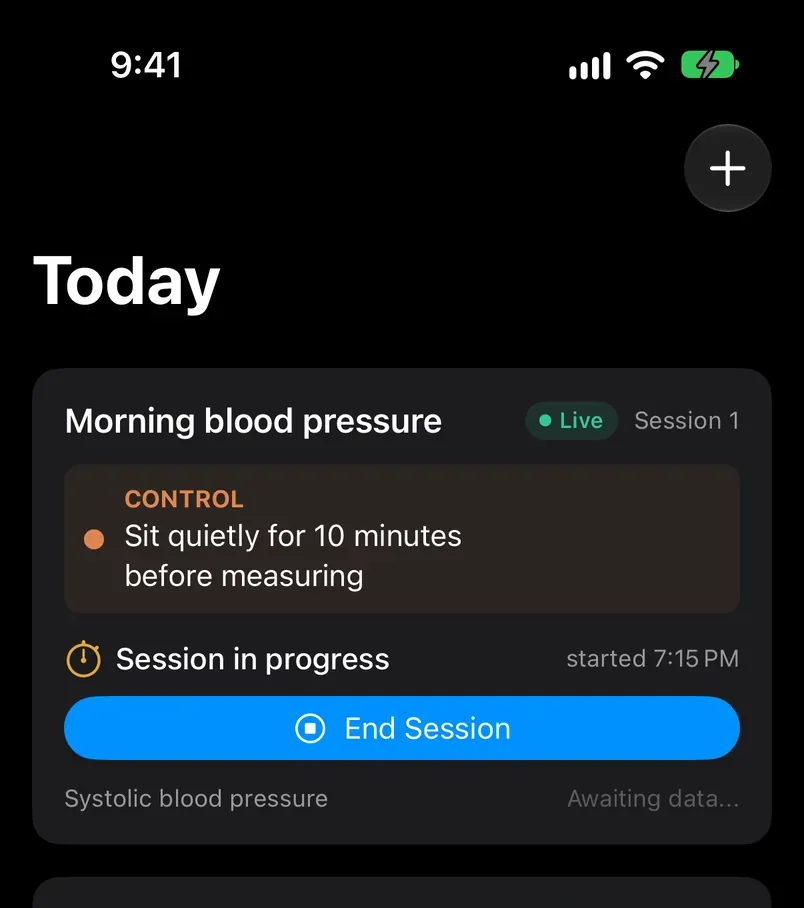
- 1The assignment badge. Treatment or Control, with the description you wrote at setup so there is no ambiguity about what to do. Blue is treatment and orange is control, everywhere in the app.
- 2The unit's status line. When the unit is measured and when its result will be in. A night reads "Measured while you sleep tonight, results by noon tomorrow". A session reads "Measuring now" until you end it.
- 3The one action, if any. A session shows End Session. A workout shows Log Workout so you can link the recorded workout. A manual metric shows Enter Result once the unit has ended. Nights and days need nothing: the result is read from Apple Health when it is due.
- 4Awaiting data. The primary metric's state for this unit. It changes to the value once it has been read or entered.
The assignment is independent of everything else that varies from one unit to the next: how you slept, what you ate, how stressed you were. So the difference between the treatment and control units is an unbiased estimate of the treatment's causal effect on you, with no model of your physiology needed for that to hold.
02Creating an experiment
Tap the plus button on the Today or Experiments tab to open the wizard. It has seven steps, and every choice it fixes is a design choice: made before the data, kept for the whole experiment. Nothing in it can be changed after the fact except the names and descriptions.
2.1The question
 1
2
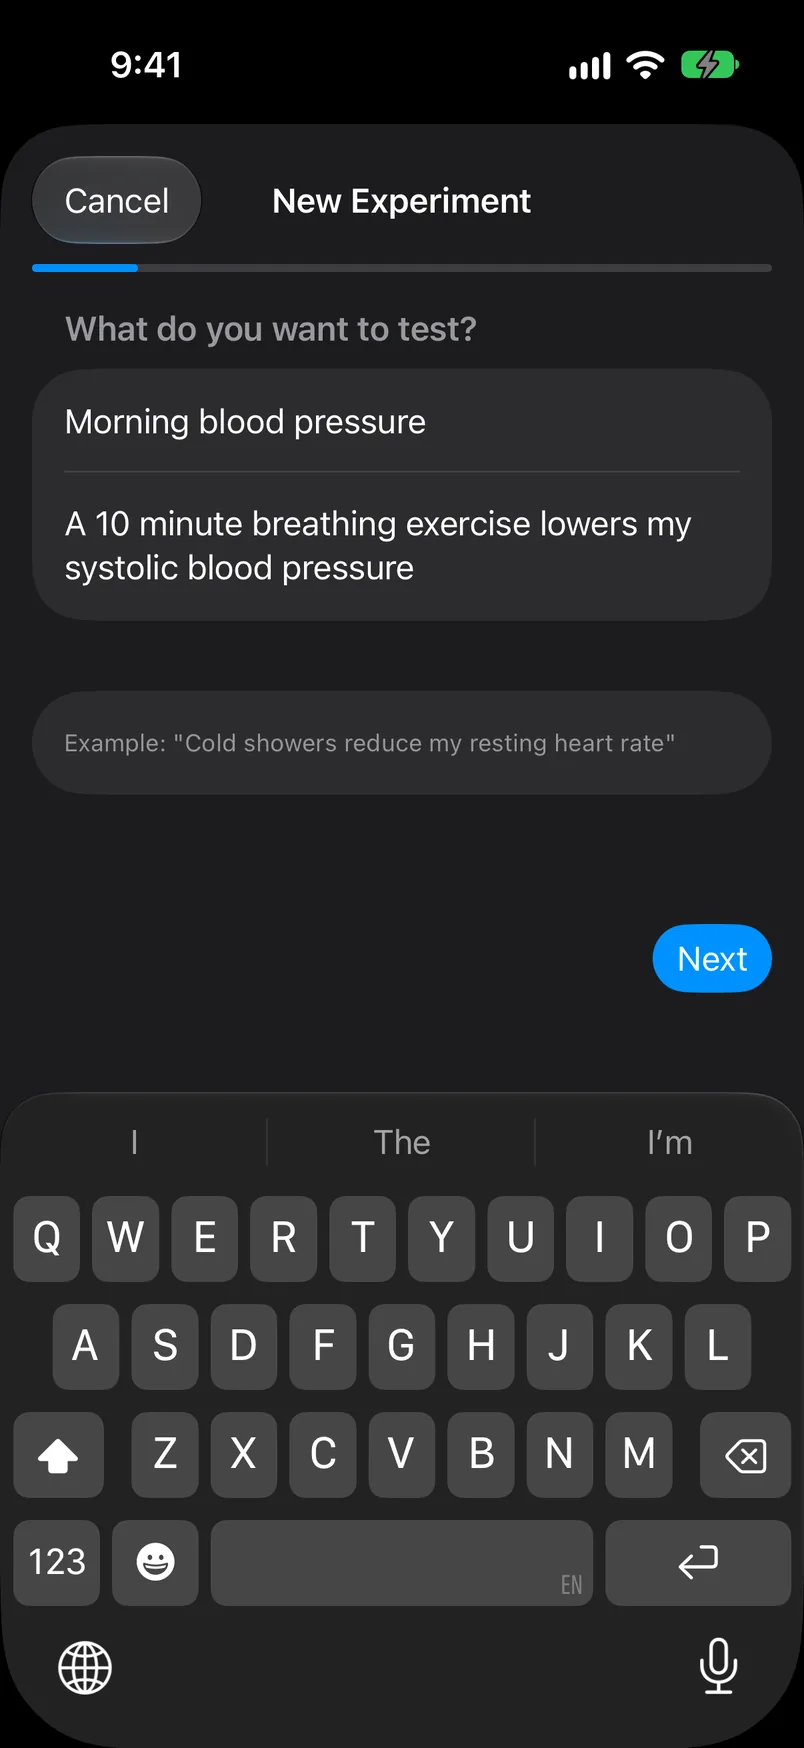
- 1Name. Short and recognisable; it heads the card, the Analysis screen and the result card.
- 2Hypothesis. One sentence with a direction in it, such as "Magnesium before bed lowers my average heart rate over the night". The analysis does not read it, but writing the direction down before you start is the point: the result will either agree with it or not.
2.2Treatment and control
 1
2
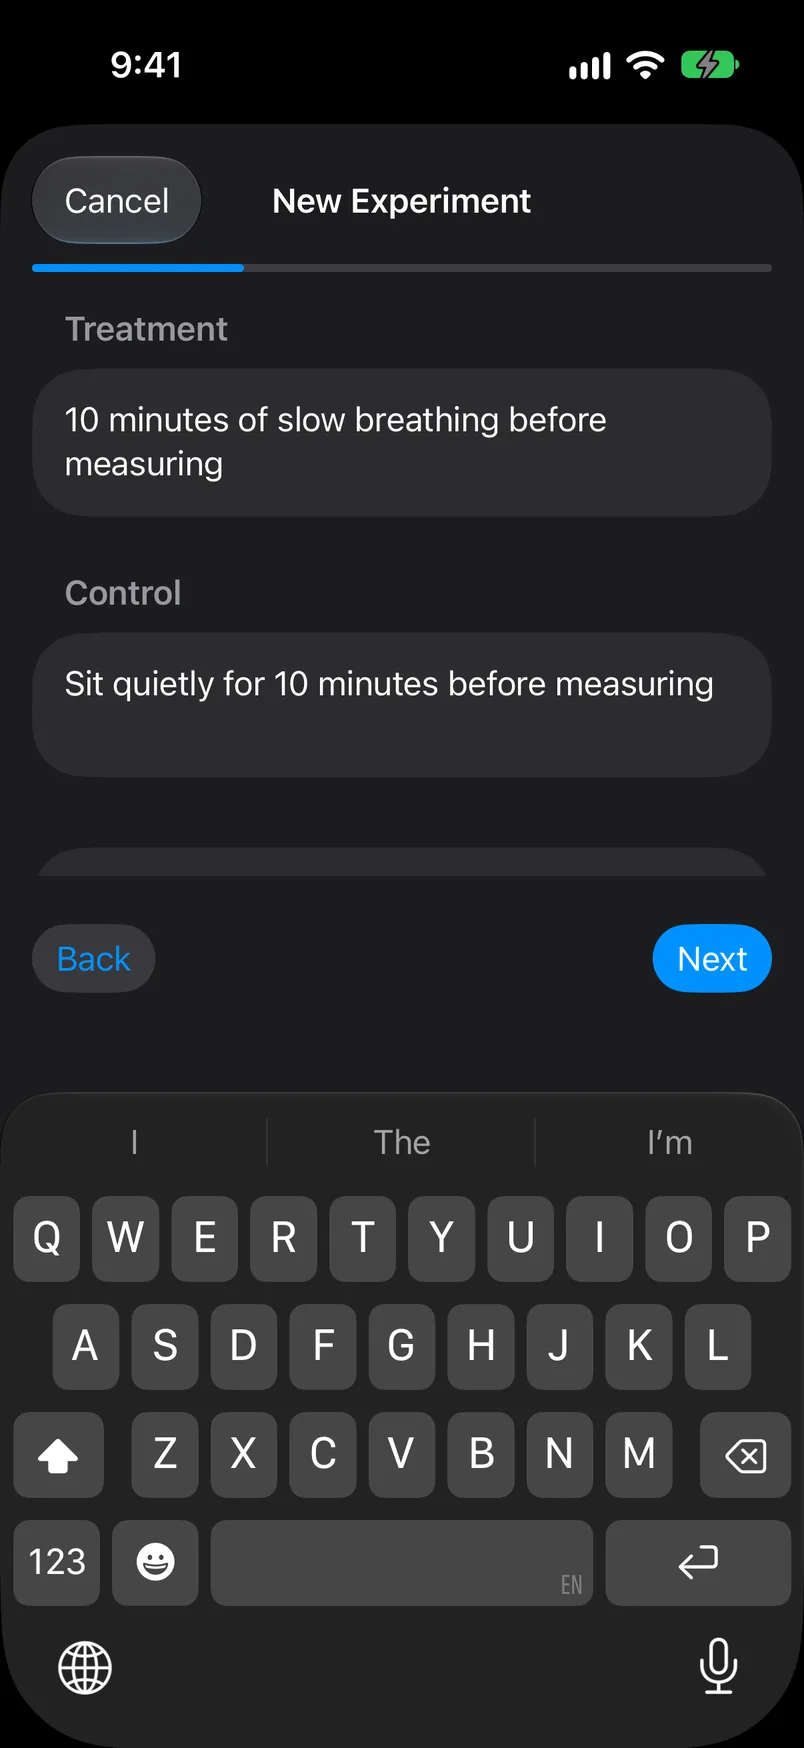
- 1Treatment. What you do when the coin says treatment. Be specific about dose and timing, because the badge will show exactly this text each time.
- 2Control. What you do instead. Usually your normal routine, but it can be an active comparison: trainers versus racing shoes, tea versus coffee.
The estimate ABMe reports is the average difference, treatment minus control, in each metric. Every unit is one or the other with probability one half.
2.3The unit
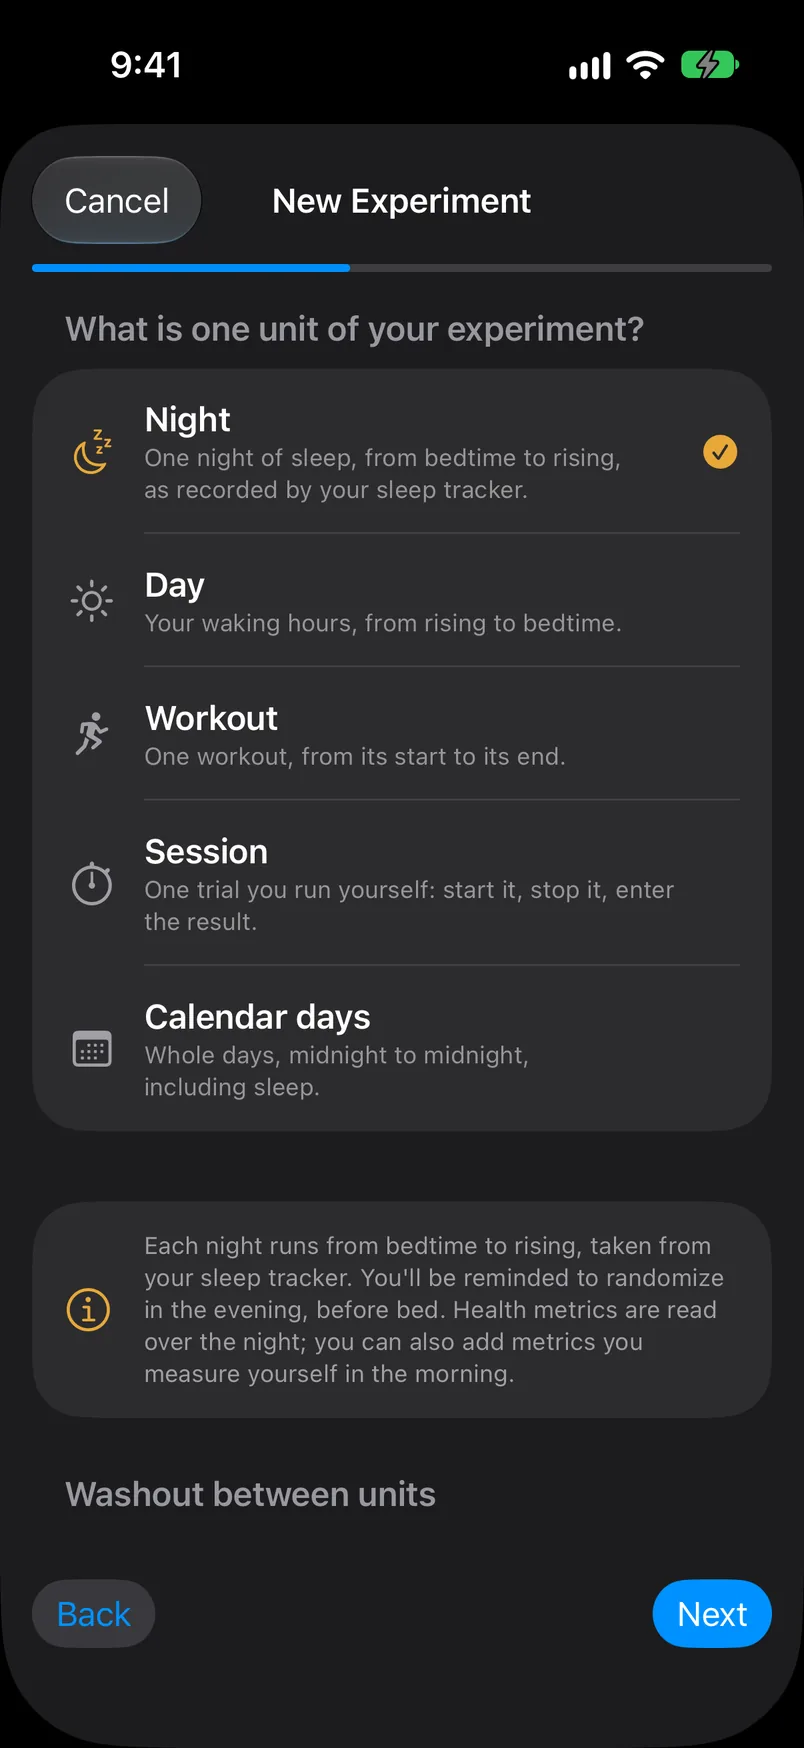
The unit is the thing that gets randomized and the window over which one result is measured. It is the most consequential choice in the design, so the wizard gives it a whole step.
 1
2
3
4
5
6
- 1Night. Bedtime to rising, taken from your sleep tracker's samples. For anything you do in the evening and measure in your sleep. A night is dated by the evening it starts, because that is when the assignment applies.
- 2Day. Rising to bedtime, your waking hours, again from the sleep tracker. You set a typical rising time and bedtime as the fallback for days with no sleep record.
- 3Workout. One recorded workout is one unit, measured from its start to its end. Randomize before you set off, then link the workout afterwards.
- 4Session. You start it with Randomize and end it yourself. For things measured on your own equipment and typed in: blood pressure, blood glucose, a reaction-time test.
- 5Calendar days. Midnight to midnight, one or more days per unit. Metrics are averaged over the days to give one result per unit.
- 6Washout. An optional gap between units, for every kind, so that a treatment with a long half-life has cleared before the next coin flip. Below the unit list, each kind also explains when its reminders fire and over what hours its metrics are read.
The unit kind decides which metric categories the next step offers (sleep metrics for nights, workout metrics for workouts) and when reminders fire. The window is fixed for the whole experiment and is never chosen after seeing the data.
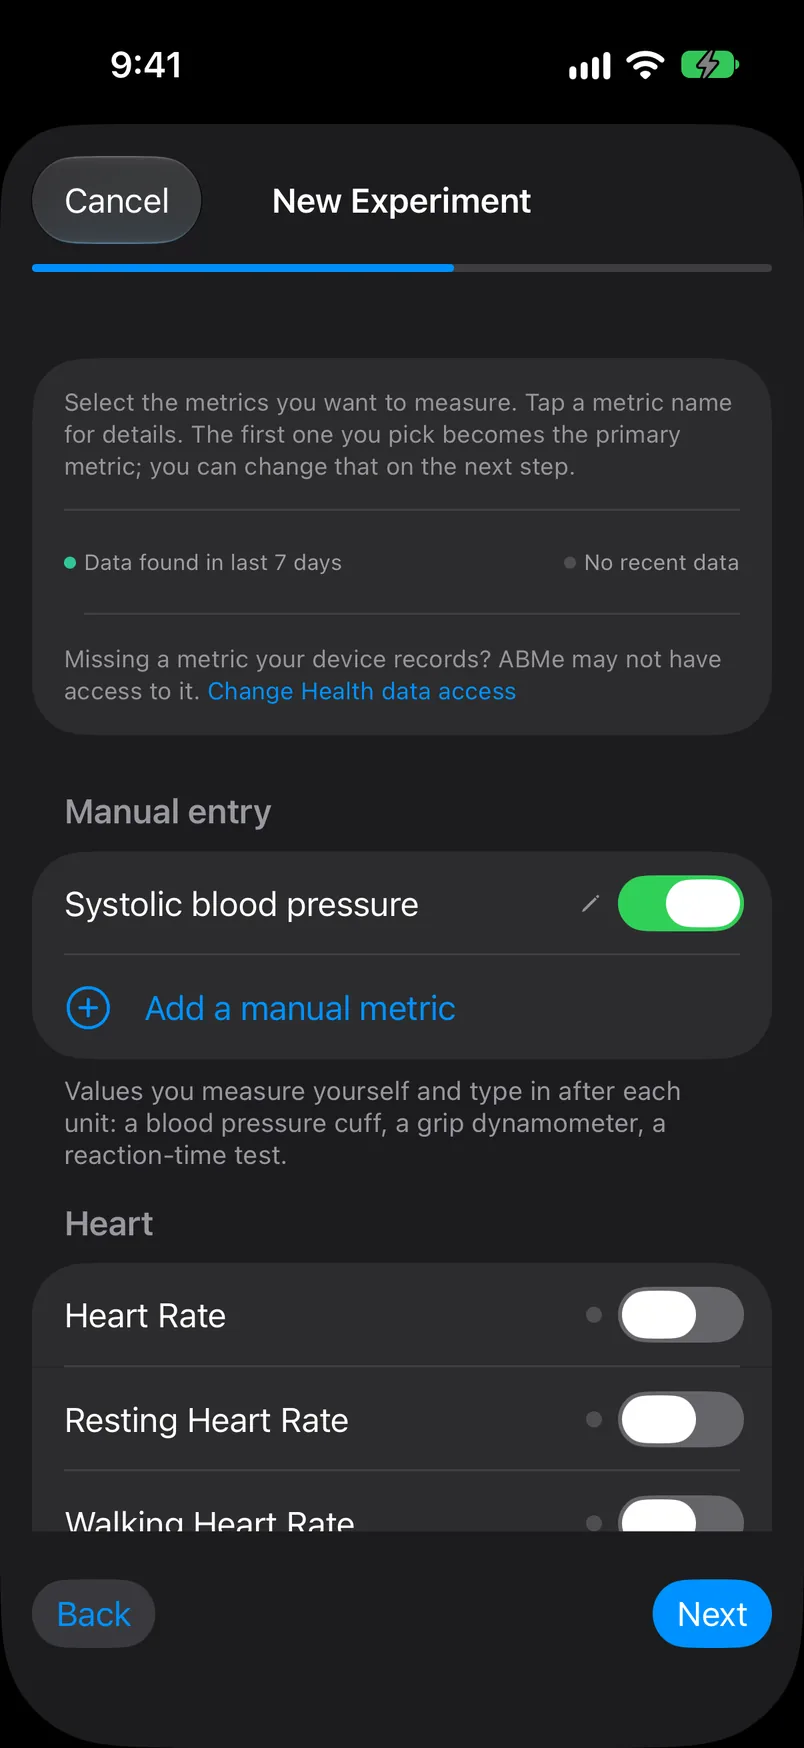
2.4Metrics
 1
2
3
- 1Manual entry. A metric you measure yourself and type in after each unit, with a name, a unit and a note on how you measure it. Keep the method the same for the whole experiment.
- 2Apple Health categories. Sleep, Heart, Respiratory, Body, Activity, Workout and so on, filtered to the ones that make sense for the unit kind. Tap a name for a description; switch it on to measure it.
- 3Availability. The dot beside each Health metric: green, "Data found in last 7 days", means a device has been writing this type recently; grey, "No recent data", means nothing has arrived or Health access for the type has not been granted. The link opens the Health app to change it. (The screens here are from a phone with no wearable, so every Health metric shows grey.)
Each metric has one fixed way of turning the samples inside a unit into a single number: heart rate is averaged, steps are summed, deep sleep is summed, maximum heart rate takes the maximum. The aggregation is part of the metric, so two experiments on the same type always measure the same quantity. Every selected metric gets its own confidence sequence.
2.5Devices
 1
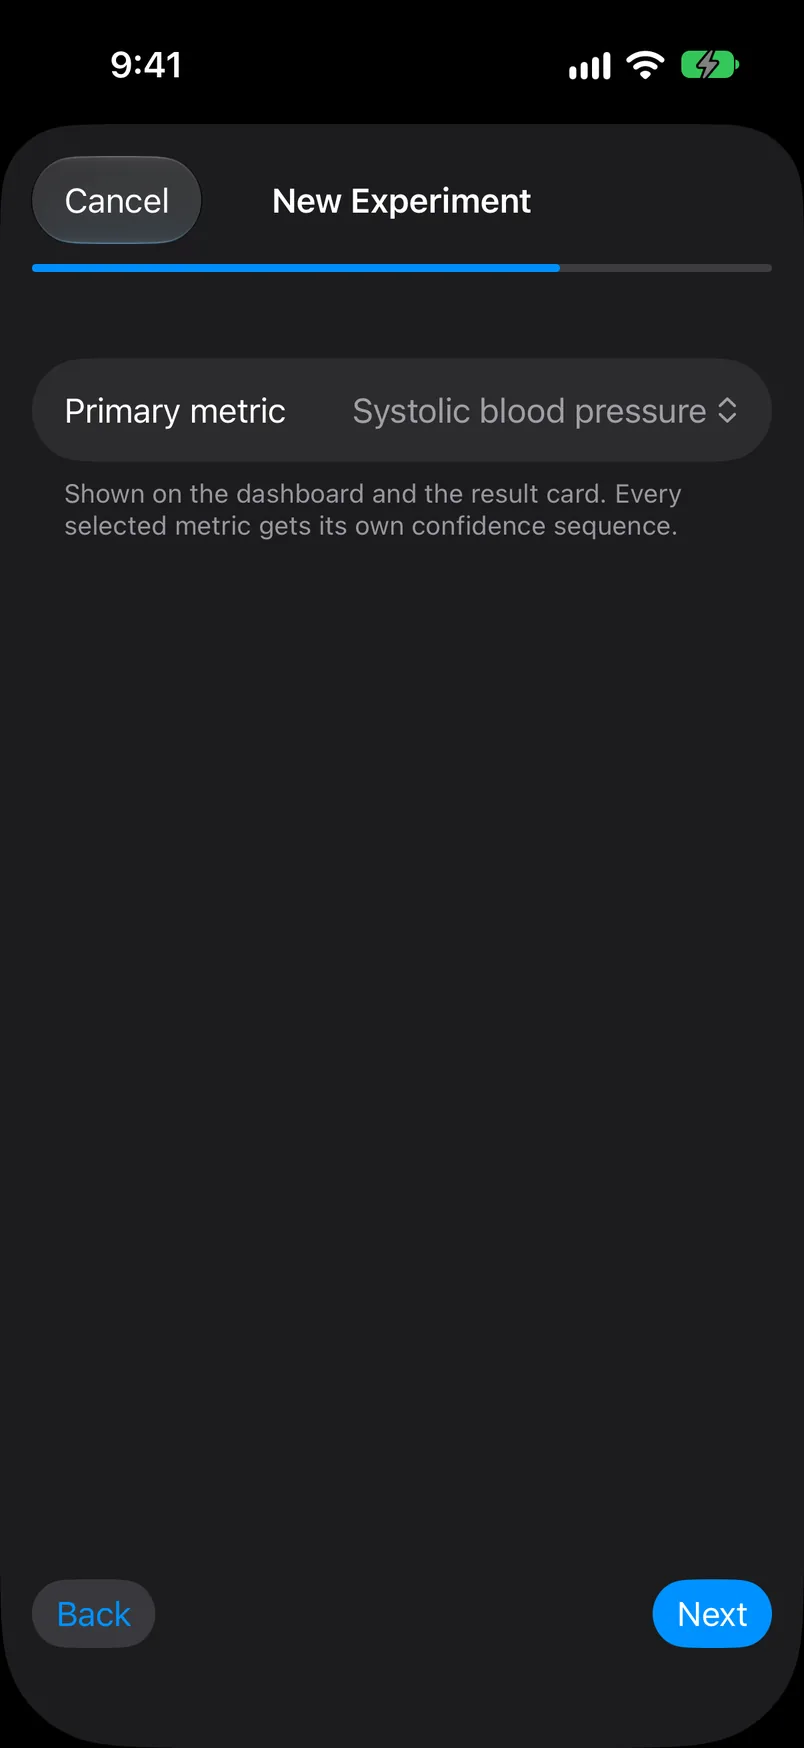
- 1Primary metric. The one shown on the Today card and on the result card. The others are analysed in exactly the same way; this only decides what is shown first.
One device per metric. Below the picker, each Health metric lists the devices that have written it, and you choose one for the whole experiment. The device that wrote it most recently is picked for you, with the date of its last data, so a replaced watch gives itself away. A manual metric, as in this screen, has no device to choose.
Two devices that write the same Health type often measure different things. One ring reports an overnight minimum as resting heart rate while a watch reports a daytime estimate. Averaging them would mix two quantities, and switching between them mid-experiment would let the device, not the treatment, move the result. So the source is fixed before the first unit.
2.6Reminders
 1
2
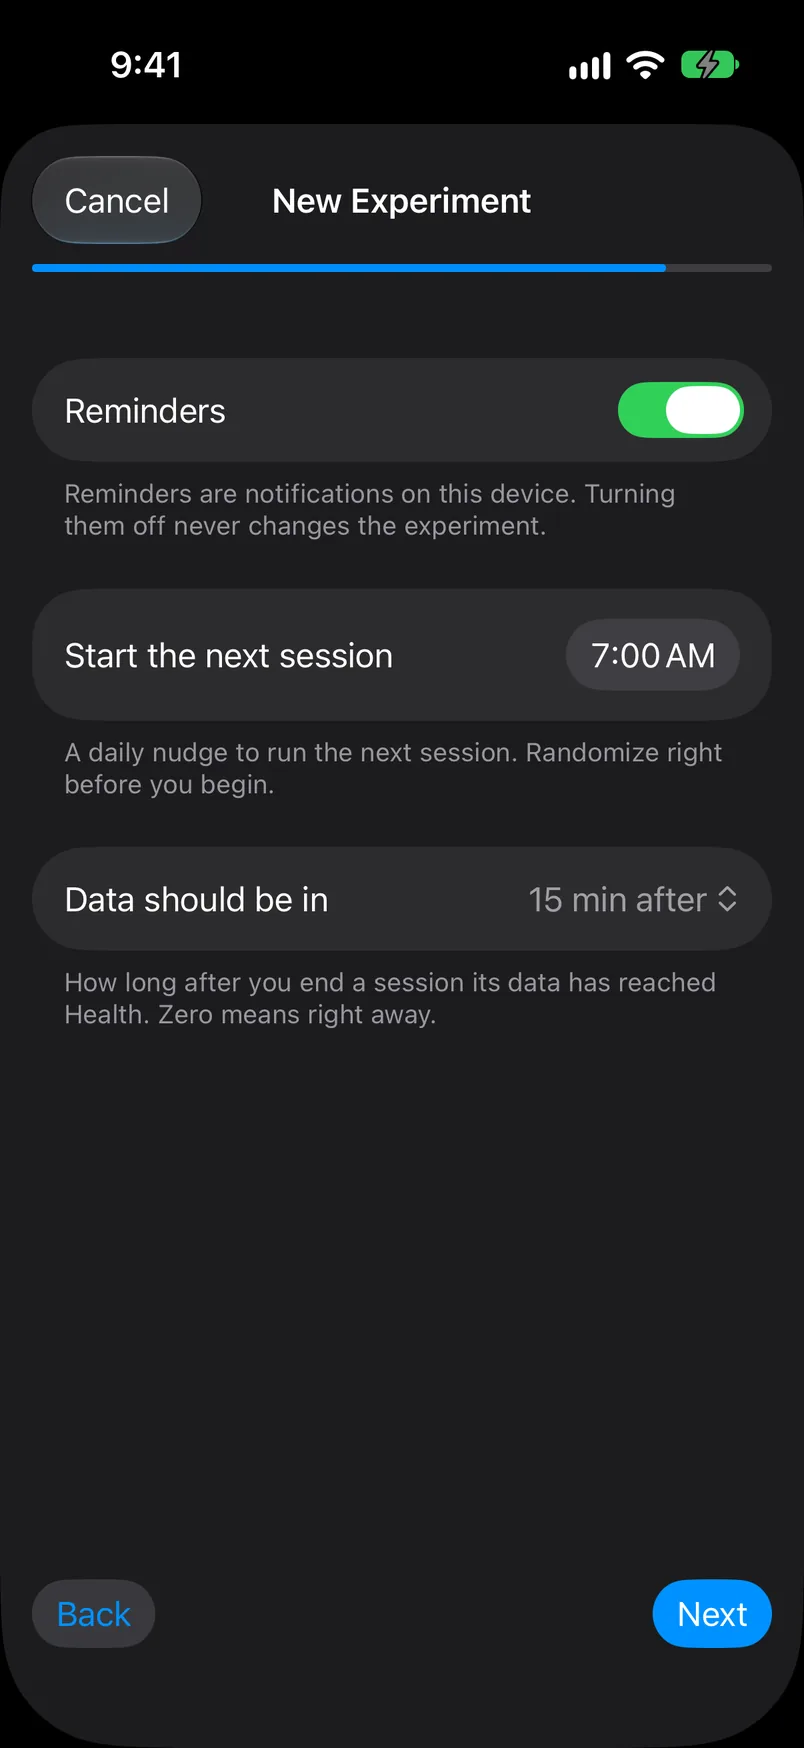
- 1Start the next unit. When ABMe nudges you to tap Randomize: in the evening for nights, in the morning for days. Workouts have no start reminder, since you randomize when you are about to train.
- 2Data should be in. When ABMe expects the unit's measurements to have reached Apple Health and reads them: a time of day on the morning after a night, or a delay after a workout or session ends. Both times can be changed later from the experiment's share menu; they move notifications and fetches, never the analysis.
2.7Review
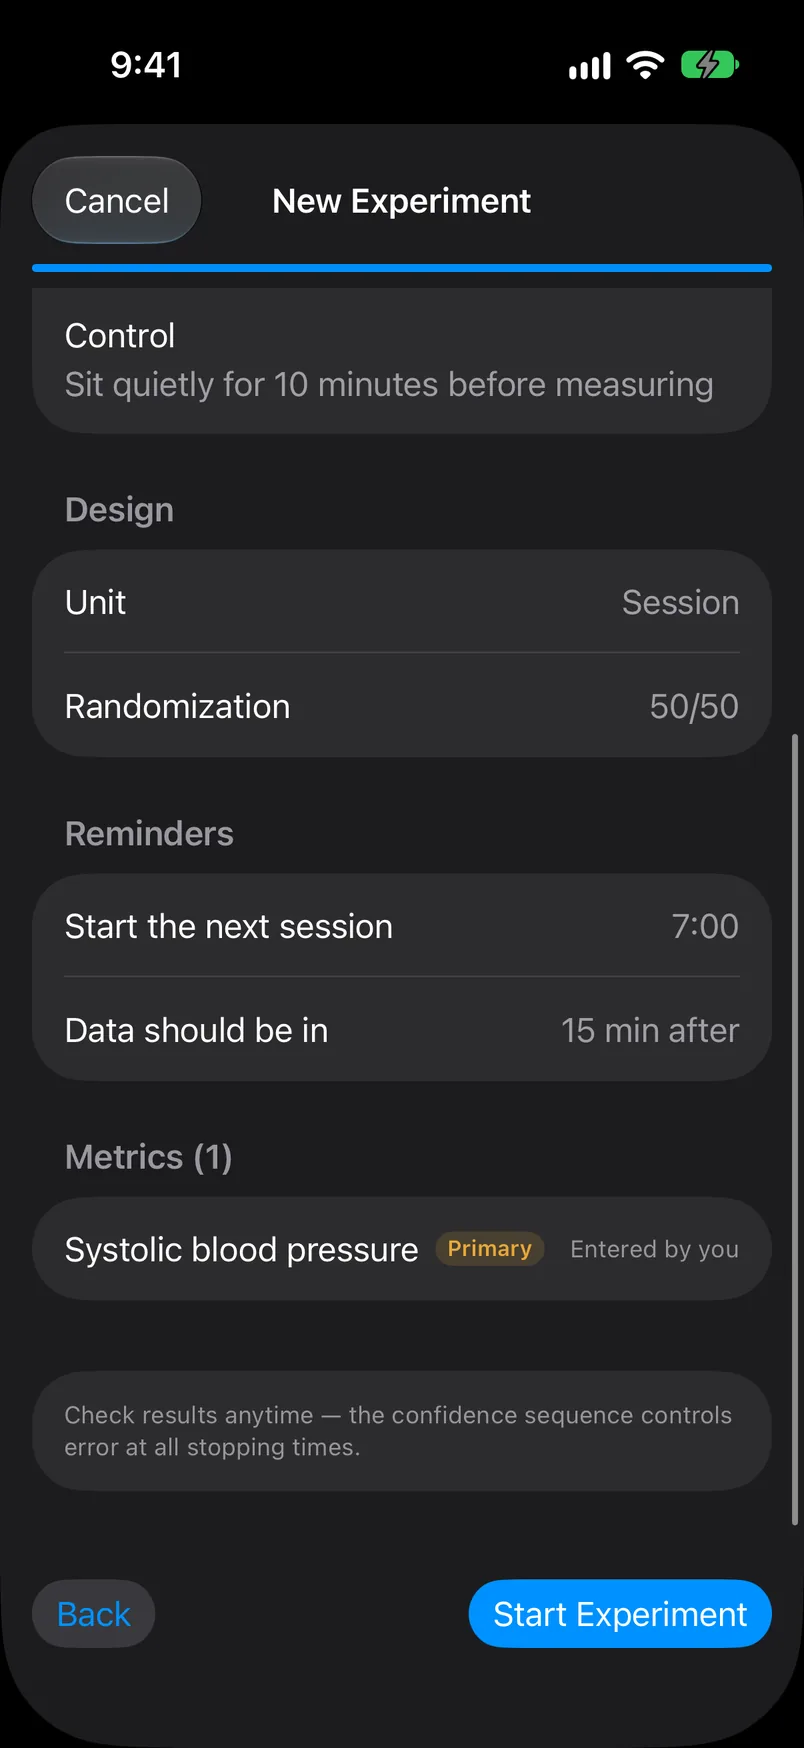 1
2
3
4
- 1Design. The unit, any washout, and the randomization probability, which is 50/50.
- 2Reminders. The two times from the previous step, as they will be scheduled.
- 3Metrics. Every metric with its device, or "Entered by you" for manual ones, and which is primary.
- 4Start Experiment. From here the design is locked. ABMe fits a forecasting model to your pre-experiment history for each Health metric (see regression adjustment) and takes you to the Today tab, where the first Randomize is waiting.
03Running a unit
A unit goes through a short life: randomized, measured, collected. The card on the Today tab and the top of the experiment screen both show where it is and the one thing it might need from you.
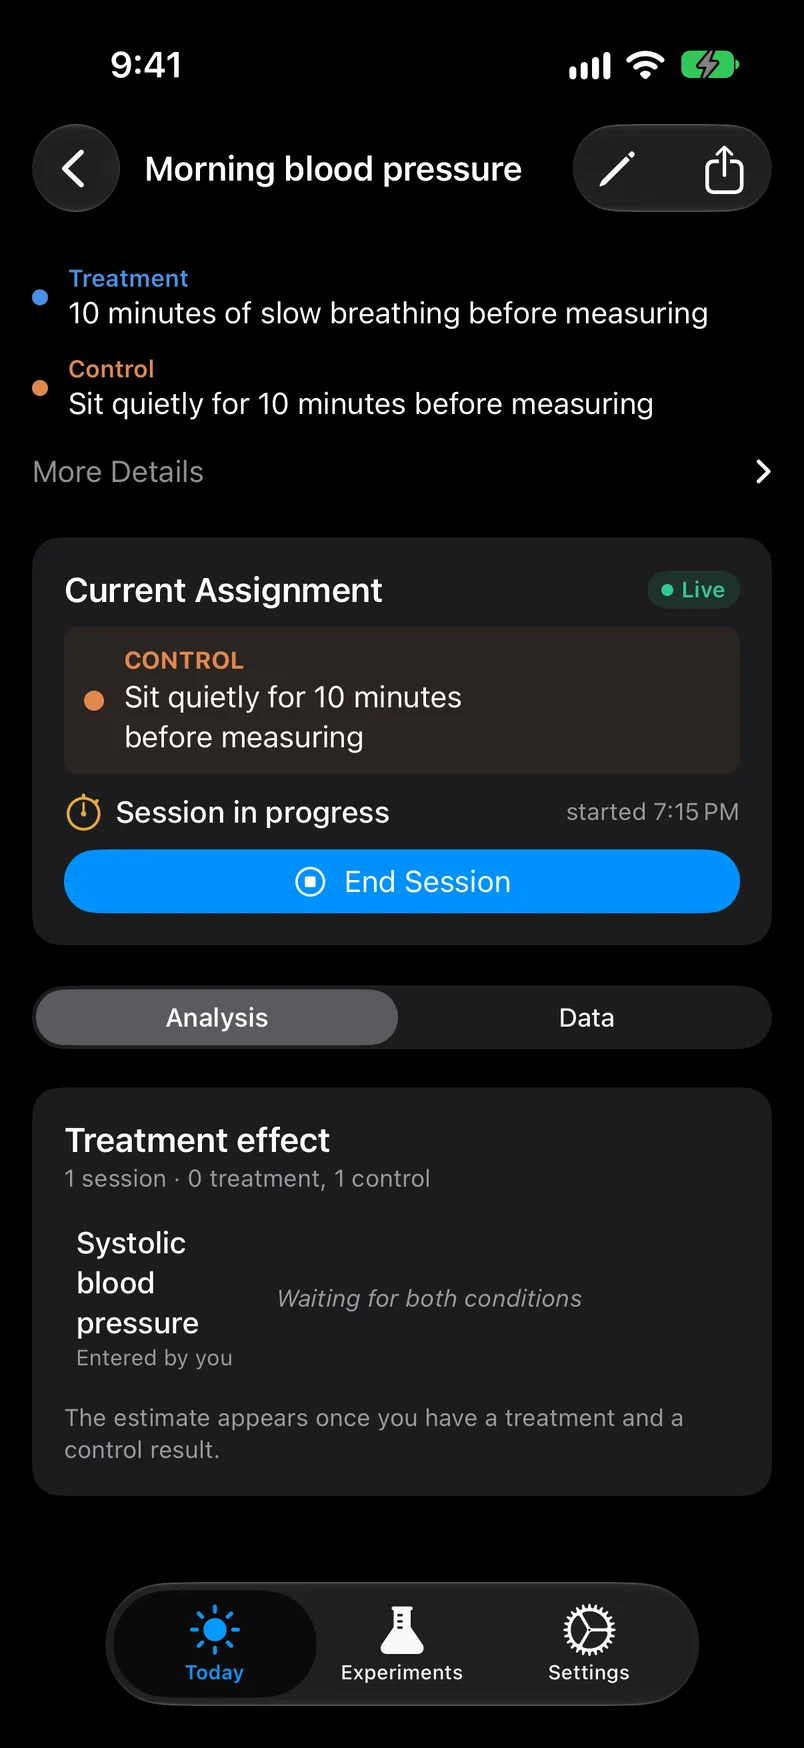 1
2
3
- 1Current assignment. The same badge as on the Today card, with Live while the window is open.
- 2In progress. The unit has been randomized and its window is open, here since 7:15 pm. For a night or a day the window is cut from your sleep record once it exists; until then a night is planned from 6 pm to noon the next day.
- 3End Session. Only sessions and workouts need you to close the window. Nights, days and calendar days close on the clock.
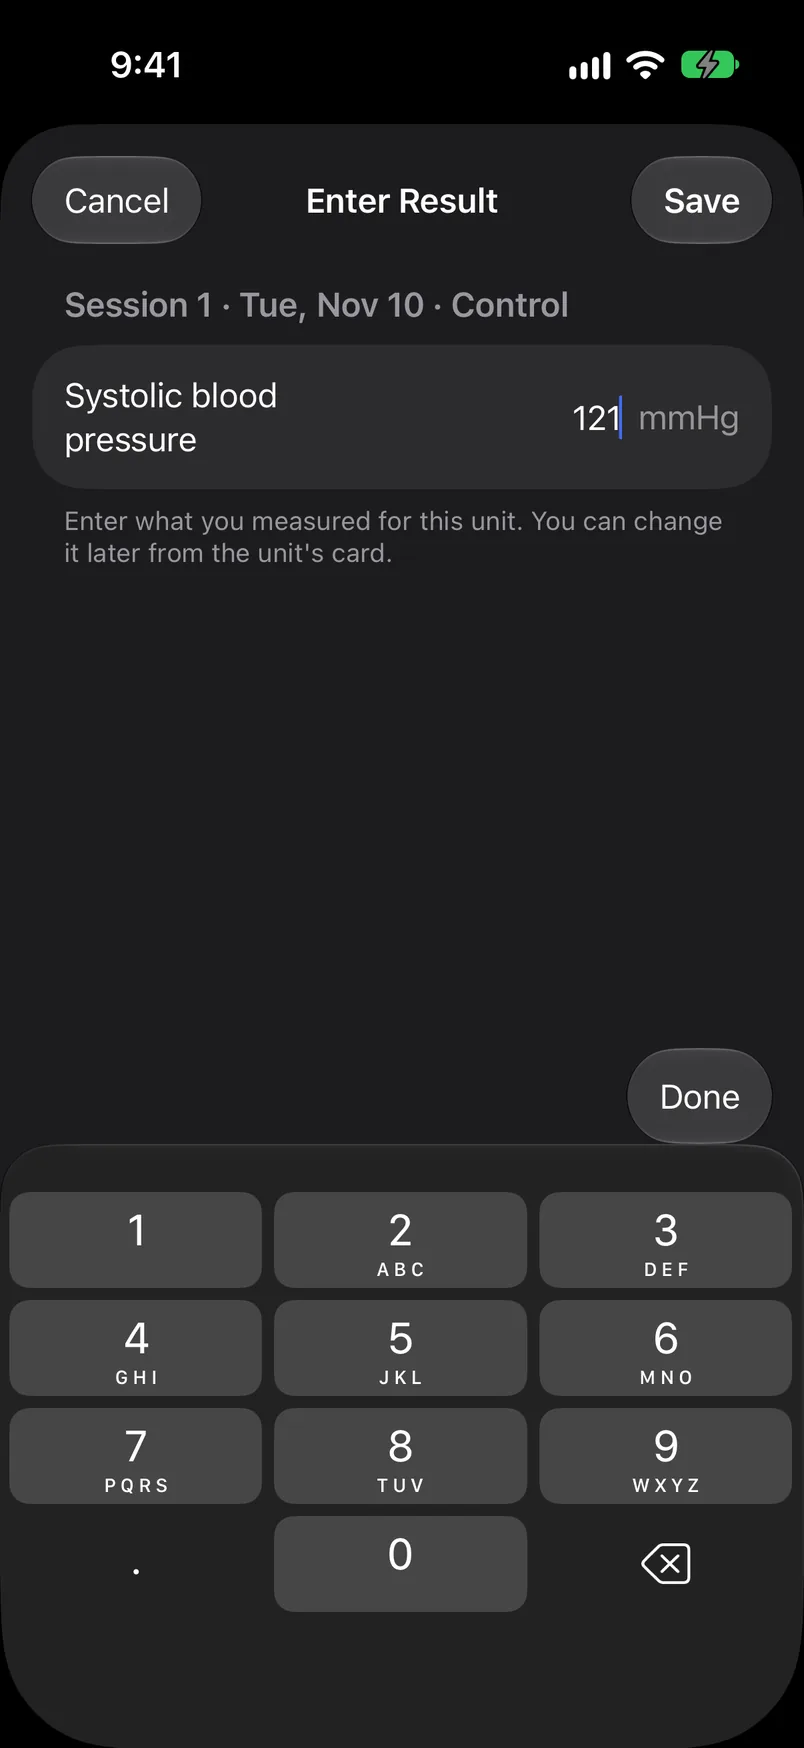 1
- 1One value per manual metric per unit. The sheet names the unit and its condition, and takes one number in the metric's own unit. ABMe never aggregates manual values; what you type is the unit's result, and you can correct it later from the unit's card. While a manual value is missing, Randomize is withheld, so you cannot run ahead of your own measurements.
Health metrics need nothing from you. At the unit's data-ready time ABMe reads Apple Health over the unit's window and stores one aggregated value per metric. If the data has not arrived yet, the unit shows "waiting for data" and is re-checked each time you open the app; a Check HealthKit button forces it.
| Unit state | Meaning |
|---|---|
| In progress | Window open. Shows Live while the current time is inside it (never for nights). |
| Awaiting entry | Window closed, a manual metric still needs its value. |
| Waiting for data | Window closed, Apple Health has not yet delivered every metric. |
| Partial | Some metrics arrived, some did not. The ones that did are already in their sequences. |
| Collected | Every metric has a value. The unit is in the analysis. |
| No data | Nothing arrived for the window. The unit counts for nothing; it is not imputed. |
04The Analysis tab
Open an experiment and the Analysis tab shows every metric on one axis, so you can see at a glance which effects are resolved, which are still wide open, and in which direction each one points.
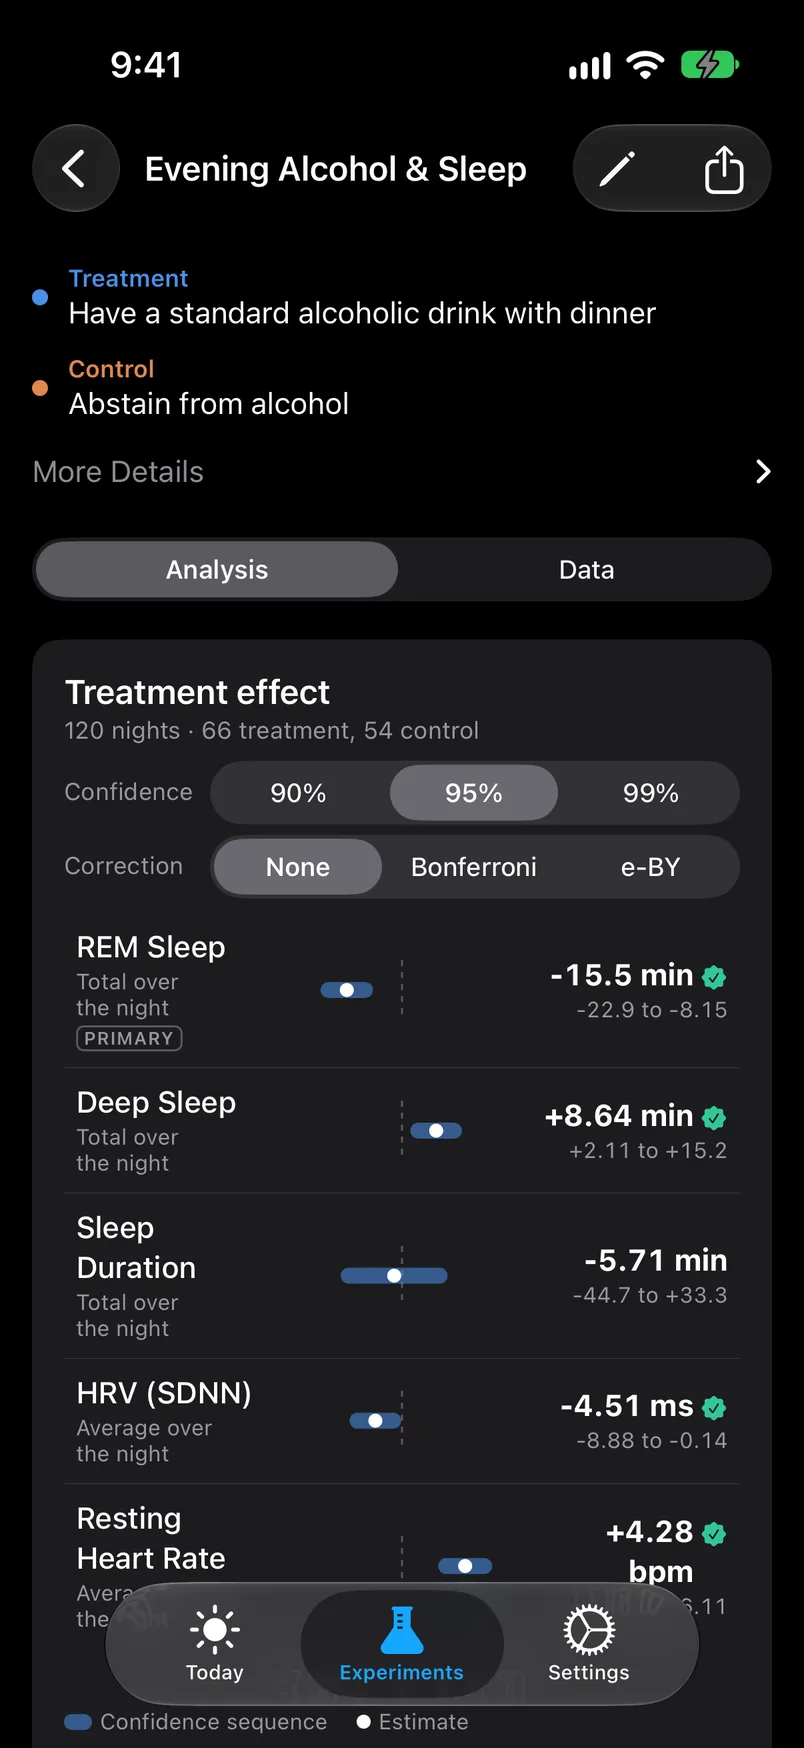 1
2
3
4
5
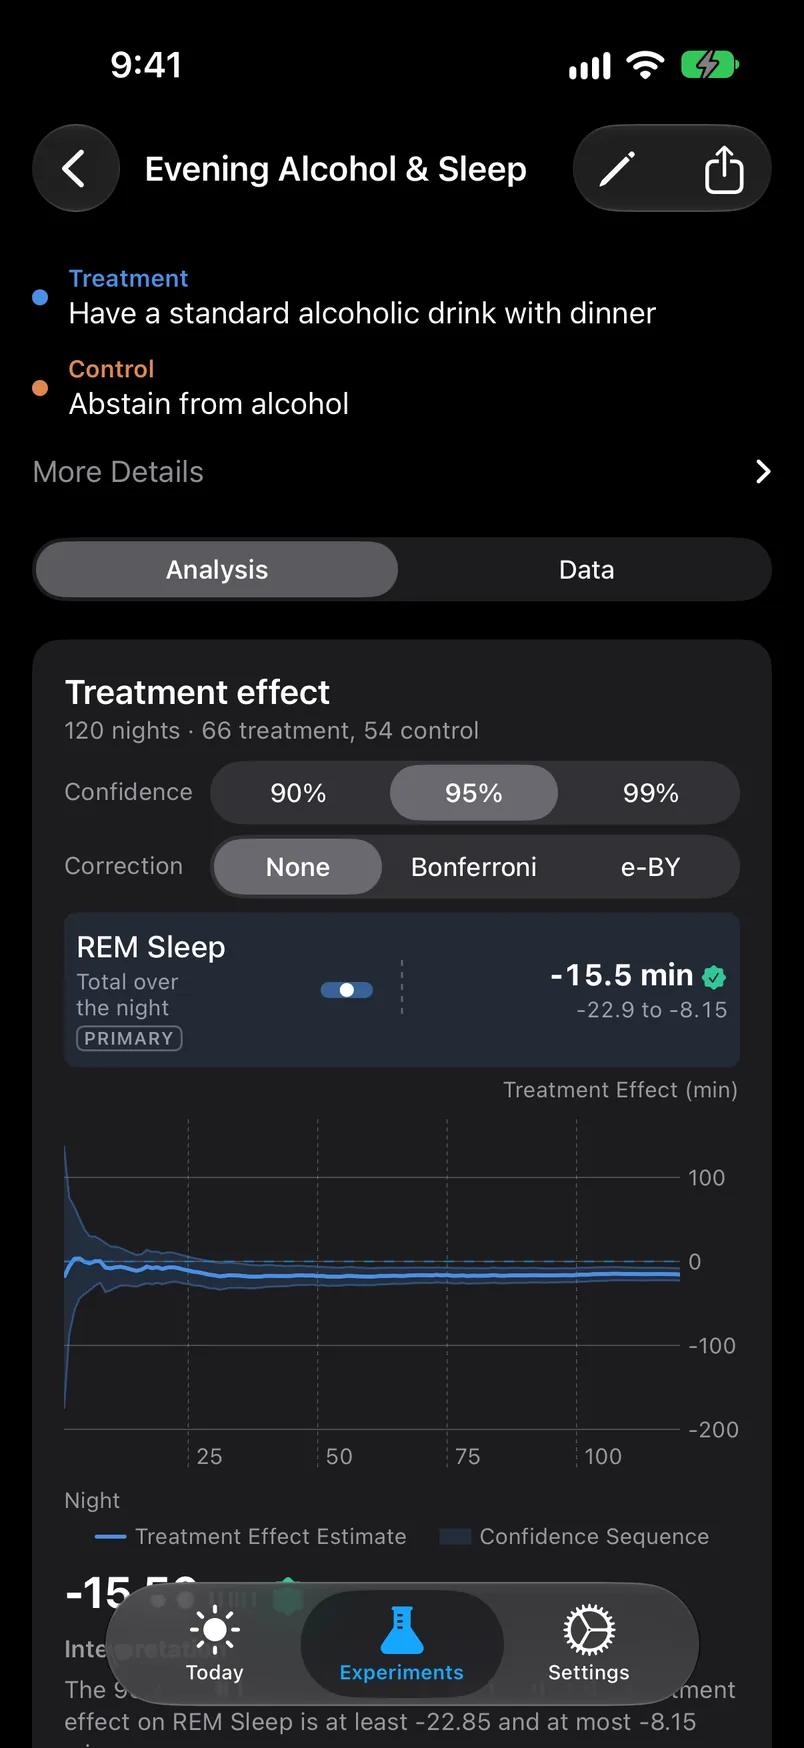
- 1The count. Units with a result so far, split by arm: here 120 nights, 66 treatment and 54 control. The split is whatever the coin produced; it is not forced to be even.
- 2Confidence. 90, 95 or 99%. Each metric's stored sequence is redrawn at the chosen level. A higher level widens every band and changes no estimate. The choice is yours to make and change after looking, because the sequence is valid at every level at once; what cannot change after the fact is the set of metrics and each sequence's tuning parameter.
- 3Correction. How the bands account for there being several metrics. None draws each at the chosen level on its own. Bonferroni draws each at the level divided by the number of metrics, so all of them hold at once. e-BY marks the metrics whose evidence clears an e-value threshold and draws the bands at a level that bounds the expected share of marked metrics whose band misses its true effect.
- 4The band. The metric's current confidence sequence, with a dot at the estimate, drawn in units of that metric's usual unit-to-unit spread so that minutes of sleep and beats per minute can share one axis. The axis is centred on zero, no effect: left of centre the treatment lowers the metric, right of centre it raises it. It always spans the same number of spreads and never rescales, so a band visibly narrows as results arrive, and an early band wider than the axis runs off its edge.
- 5The estimate. The current average treatment effect in the metric's own units, with its interval beneath. A seal marks a band that excludes zero at the displayed level. The first metric chosen at setup is tagged primary.
 1
2
3
4
- 1The open row. Tap a metric to open it; tap again to close. One row is open at a time, and the Data tab follows the same metric.
- 2The running estimate. The line is the average treatment effect after each unit. It moves a lot in the first few units and settles as they accumulate.
- 3The band over time. The shaded area is the interval after each unit. It is wide at the start and shrinks at roughly one over the square root of the number of units, faster when the metric is quiet and the forecasts are good.
- 4Zero. The dashed line at no effect. The experiment has an answer for this metric once the band sits on one side of it and stays there; the band's edges then say how big the effect is, at least and at most. Beneath the chart, the same reading is written out in a sentence: at least this much, at most that much, and whether there is clear evidence of a nonzero effect.
An ordinary confidence interval is only honest if you fix the sample size in advance and look once. These bands are anytime-valid confidence sequences: at the 95% level, the probability that the true effect ever leaves the band, at any unit, now or in the future, is at most 5%. That is what makes "check every morning and stop when it is clear" a legitimate rule rather than a way of fooling yourself.
The estimate is hidden until at least one treatment unit and one control unit have a result. With one arm only, the estimator is still defined but is driven by the empty arm's forecast, and the number would mislead.
05The Data tab
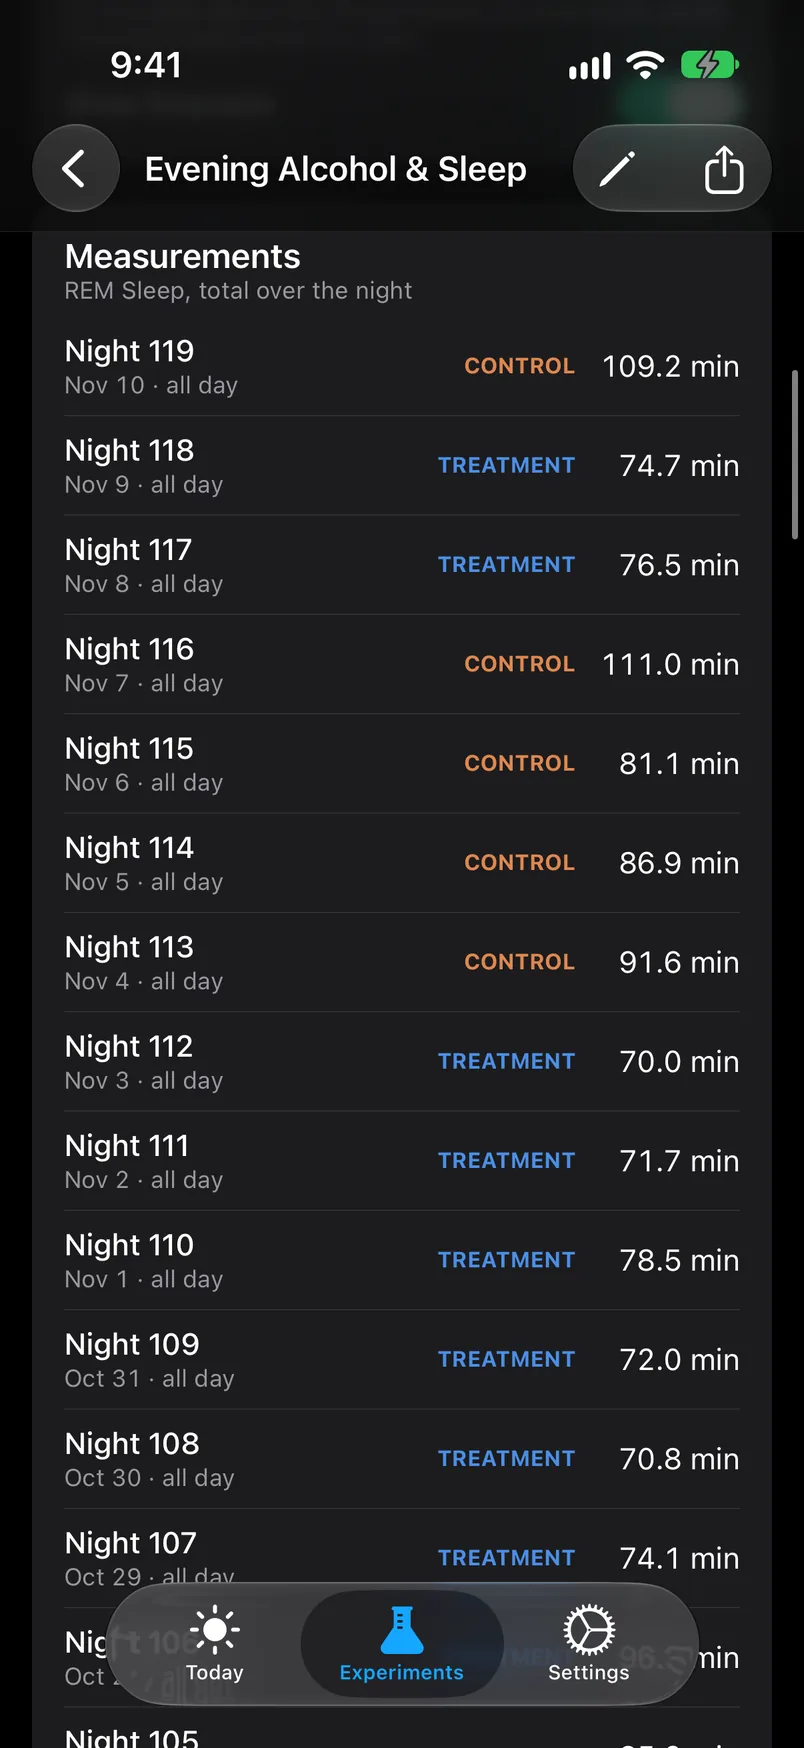
The Data tab is the measurement log: what was read for each unit and from which window, beneath a chart of the values over time that the next section explains.
 1
2
3
4
- 1Which metric. The list shows one metric at a time, named with its aggregation: "REM Sleep, total over the night". Experiments with several metrics have a selector at the top of the tab.
- 2The unit. Its index and date, newest first, and the window it was measured over. A night or day cut from a sleep record shows the resolved span, such as 23:12 to 06:48, with the sleep tracker that set it.
- 3The condition. Treatment or control, as the coin decided. This is the only place the full sequence of assignments is listed.
- 4The value. The aggregated result in the metric's unit, or the unit's state instead: "waiting for data", "no data", or "No entry" for a manual metric still to be typed in.
06Regression adjustment
Randomization makes the estimate unbiased. What makes it precise, so that the band narrows in weeks rather than months, is regression adjustment: before each unit, ABMe forecasts what the metric would be, and the unit's contribution to the estimate is the difference between what was measured and what was forecast, scaled by the assignment.
 1
2
3
4
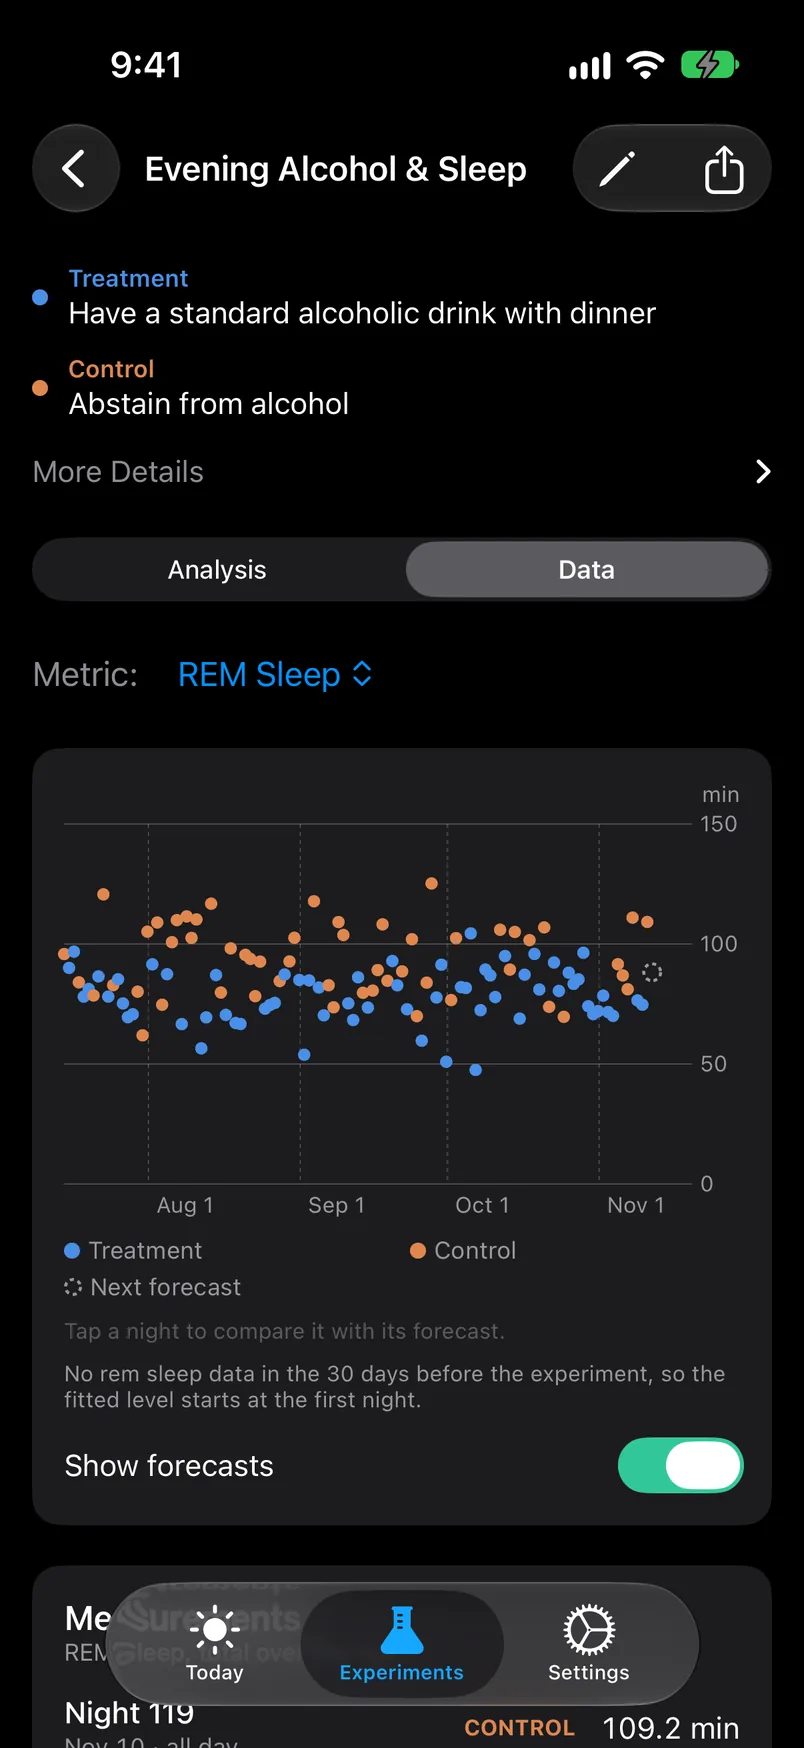
- 1Metric selector. The chart, the list below it and the Analysis tab's open row all follow this choice.
- 2Measured values by unit. Blue points are treatment units, orange are control, in time order, in the metric's own units. With a treatment effect, the two colours sit at different heights.
- 3Forecasts. With forecasts switched on, the chart also draws the model's fitted level through the points and the forecast for the next unit, and you can tap a unit to compare it with the forecast made for it: "Forecast 84.1, Measured 96.3, 12.2 above". Each forecast is a one-step-ahead prediction from a local-level model fitted to your own pre-experiment history for this metric and device. It is made before the unit's value is seen and is the same whichever arm the unit lands in, so it cannot depend on the assignment.
- 4Show forecasts. Hides or shows the model's lines. A note explains when the model had no pre-experiment history to start from, as here, and so began at the first unit.
Because the forecast is fixed before the unit runs and does not use the assignment, subtracting it cannot bias the estimate. It only removes variance you would otherwise be paying for: slow drifts in fitness, season or routine. Treatment units systematically above their forecasts and control units systematically below is what a positive effect looks like once that drift has been forecast away. A poor forecast costs precision, never validity. Metrics without enough history fall back to a running mean of the experiment's own units, which has the same property.
The models are fitted when the experiment is created, one per metric and device, and kept for its whole run. Settings offers to retrain them for future experiments after a long gap in data or a change of routine.
07Editing, stopping, deleting
 1
2
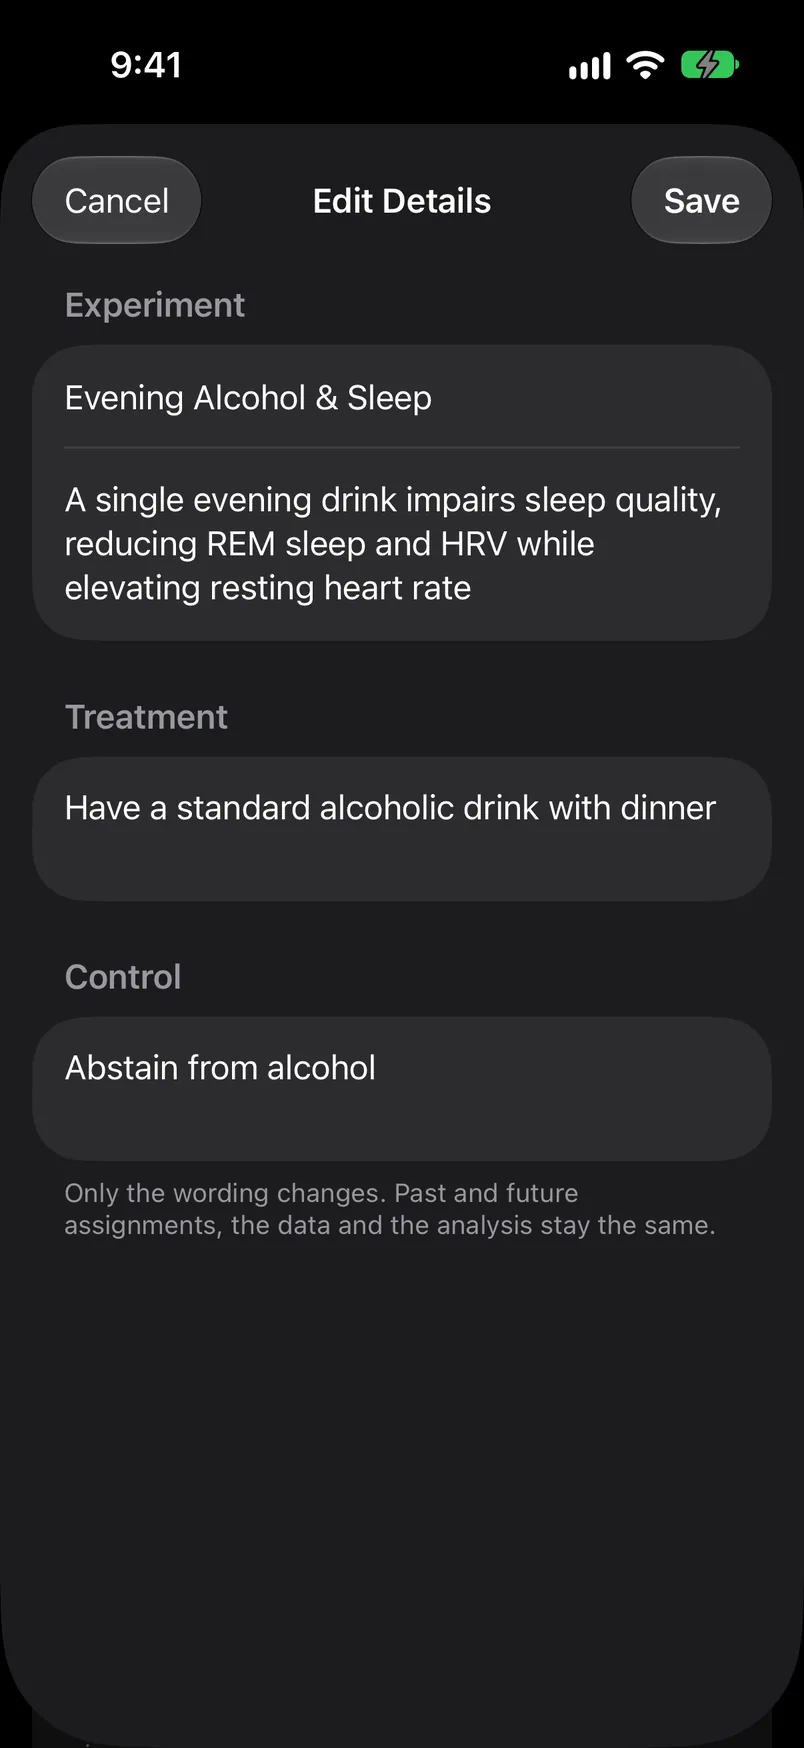
- 1Names and descriptions only. The name, hypothesis, treatment and control text can be corrected at any time. Nothing that affects the analysis is editable here: not the unit, the metrics, the devices or the randomization. Renaming reschedules the experiment's reminders and updates its public copy if it has been published.
- 2The guarantee. Only the wording changes. Past and future assignments, the data and the analysis stay the same. Reminder times are edited separately, from the share menu.
 1
2
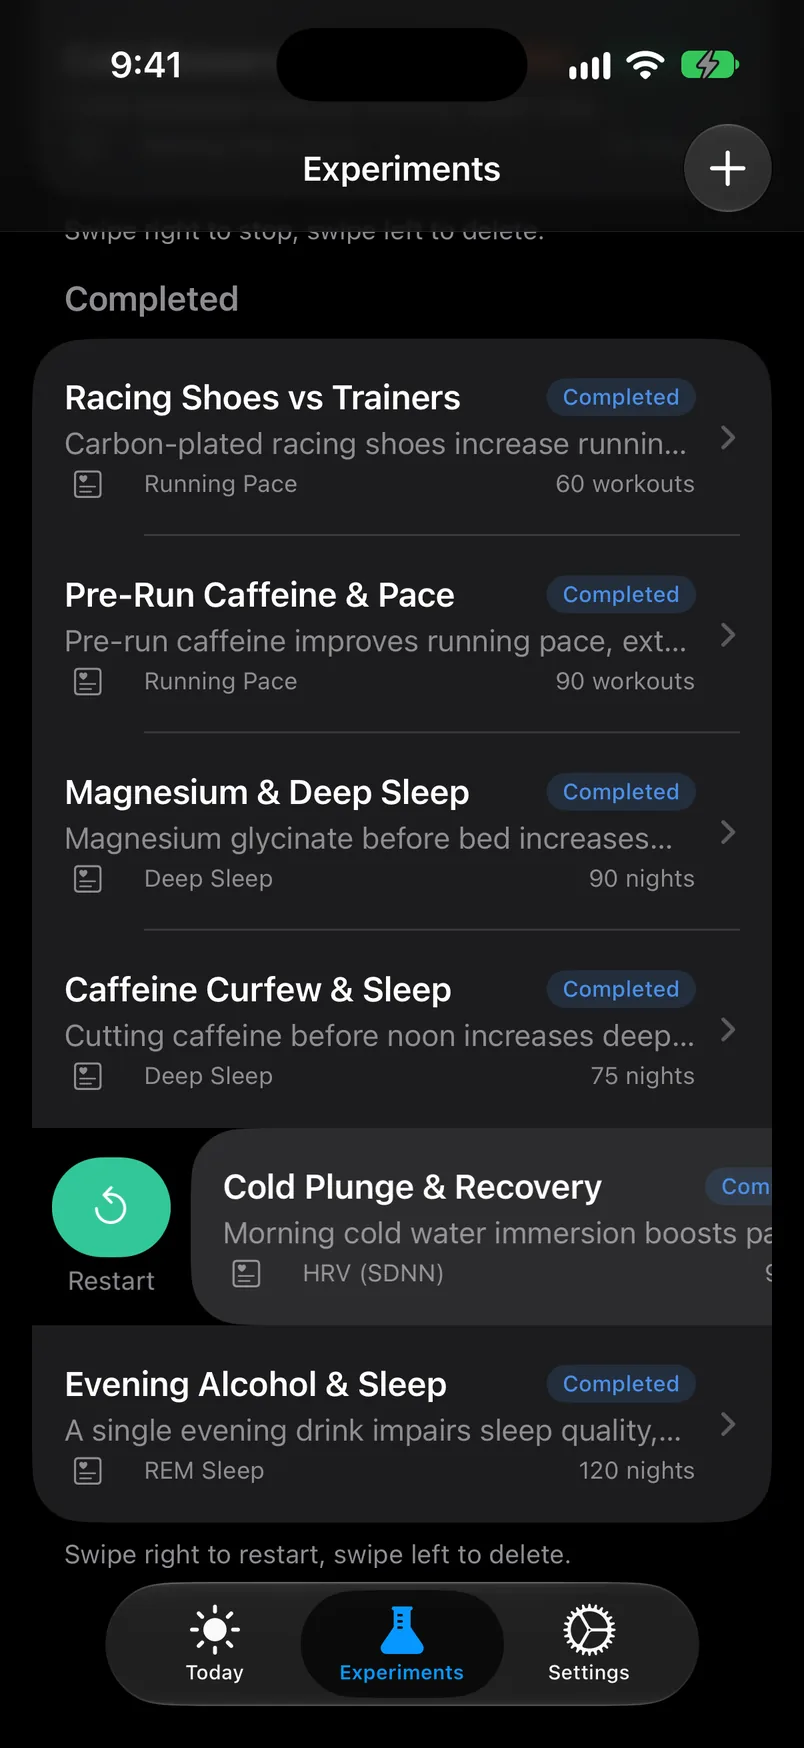
- 1Stop and Restart. Stopping ends the experiment where it is and keeps every unit and its analysis. Restart picks it up again with the next unit index; the sequence continues, it does not start over.
- 2The hint. Each section of the list says what its swipes do.
Delete, by swiping left, removes the experiment and all its data from the phone and from your private iCloud. A published copy stays public. Deleted example experiments stay deleted; Settings can restore the set.
08Publishing and sharing
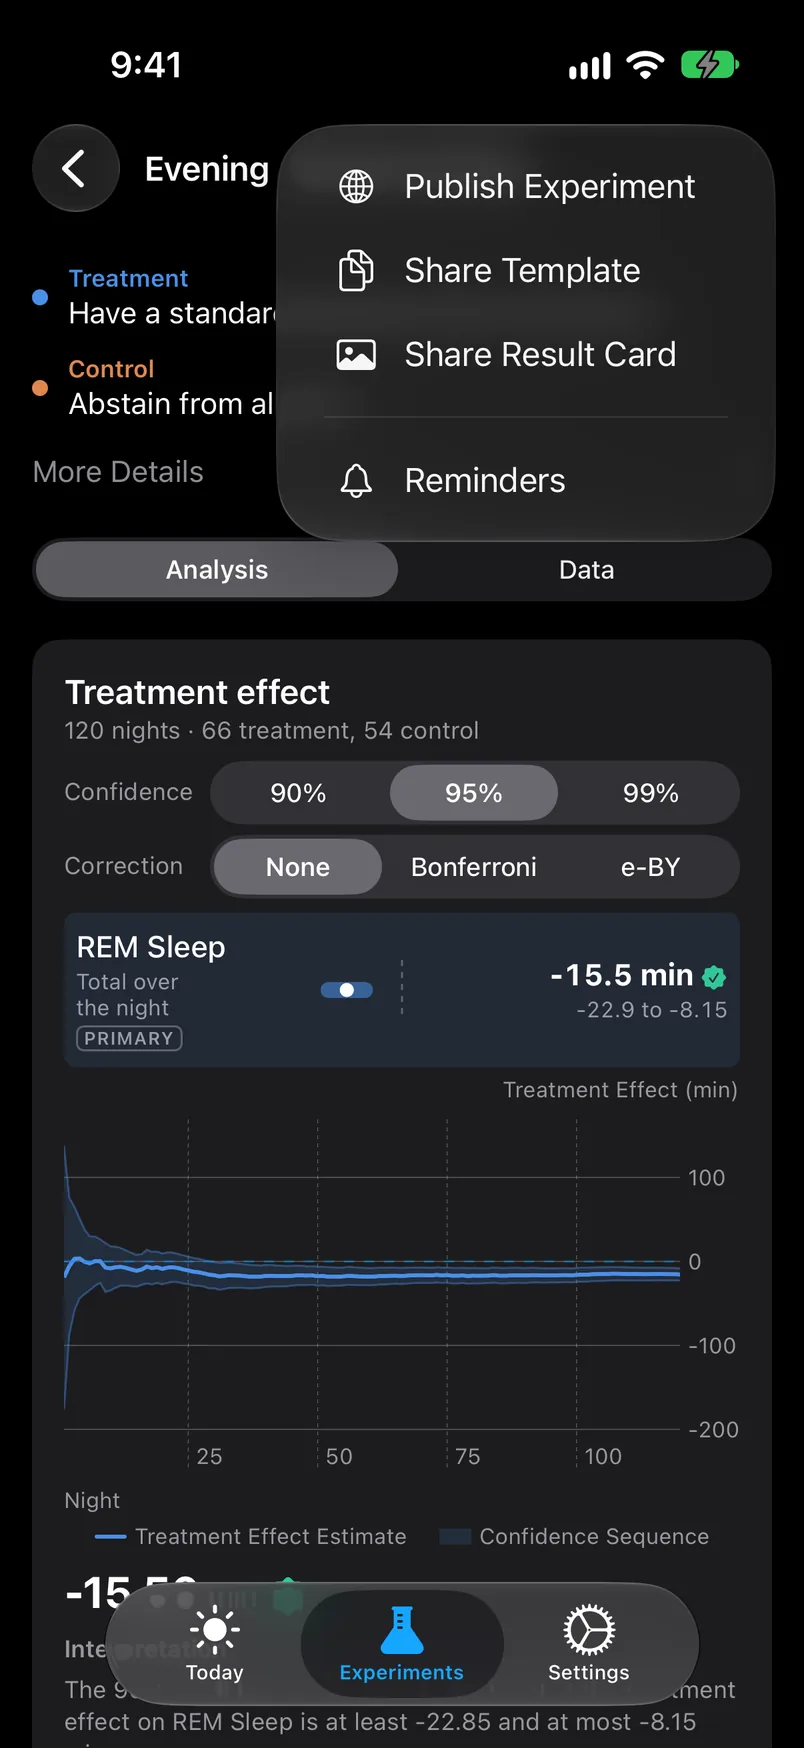
ABMe has no accounts and no servers of its own. Everything is stored and analysed on the phone, with a copy in your private iCloud. Sharing is opt-in, per experiment, and the share menu says exactly what leaves the phone each time.
 1
2
3
4
- 1Publish Experiment. Writes the design, the per-unit assignments and the per-unit observation values for this experiment's metrics to a public iCloud database, under a researcher profile created with Sign in with Apple the first time. Others can follow it and run the same design on themselves. Raw Health data outside the experiment's units and metrics is never included. There is no unpublish.
- 2Share Template. Sends the design only: question, arms, unit, metrics, aggregation. No results. Whoever receives it can start the same experiment with one tap.
- 3Share Result Card. An image of one metric's confidence sequence with the estimate and interval at the experiment's 95% level, for a message or a post. It carries the chart, not the measurements.
- 4Reminders. The two times set in the wizard, editable while the experiment runs.
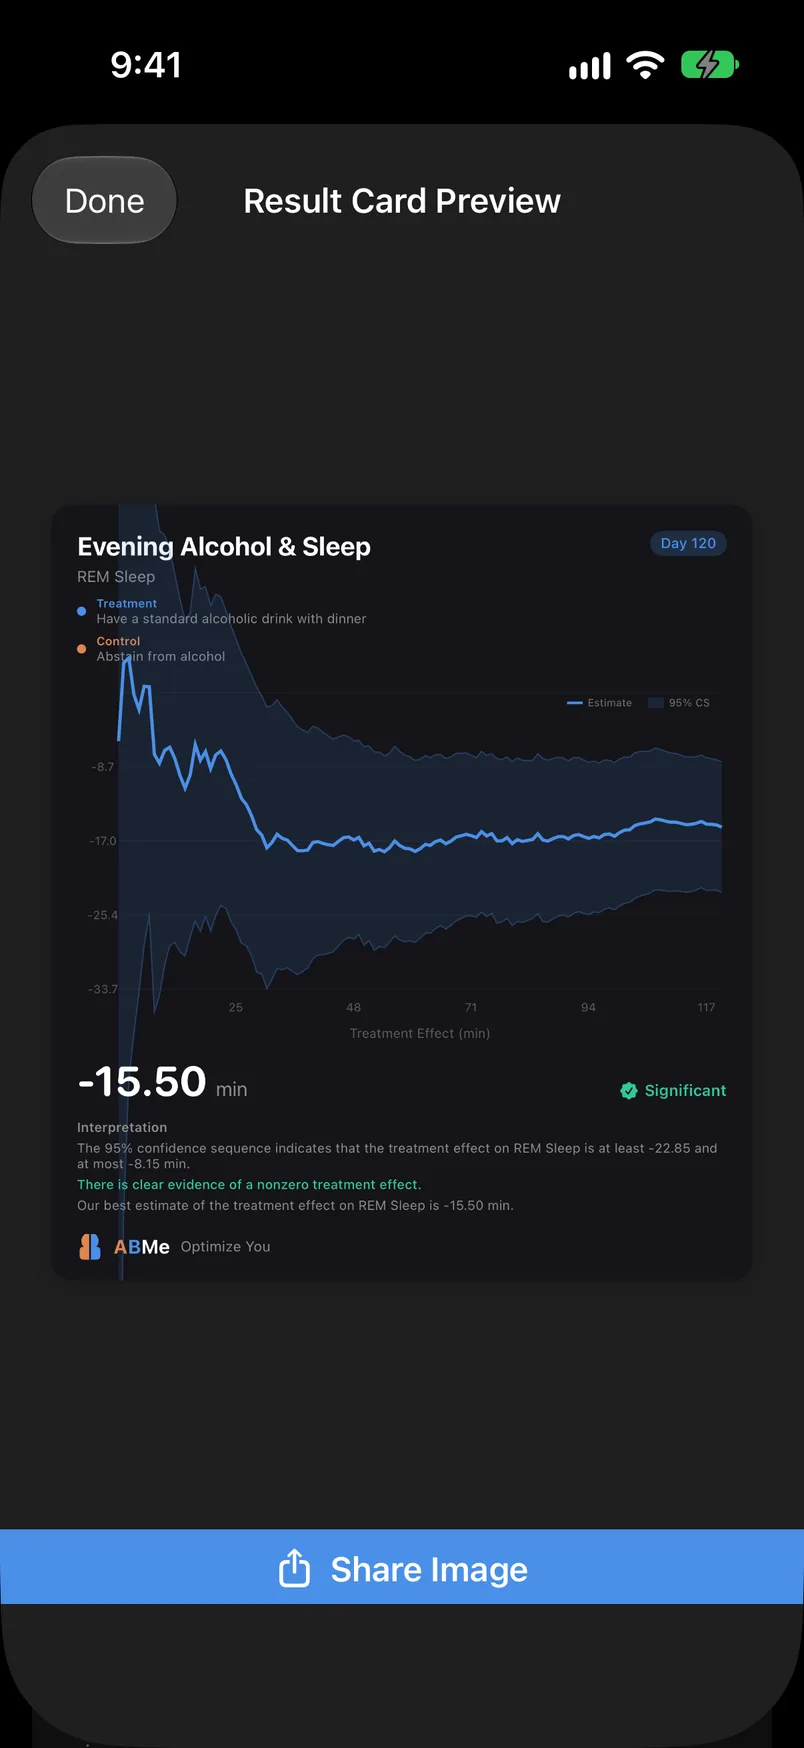
The card shows the experiment's name, the two arms, the metric, the number of units, the confidence sequence, the estimate with its interval and the same written interpretation as the Analysis tab. It is rendered on the phone from the same stored sequence, and shared as an image.
Before anything is published, the sheet lists exactly what will be shared: the experiment's name and hypothesis, its metrics, the number of units of observation data and the confidence sequence results, with a privacy note that raw Health data from other metrics or periods never leaves the phone.
09Settings
 1
2
3
4
5
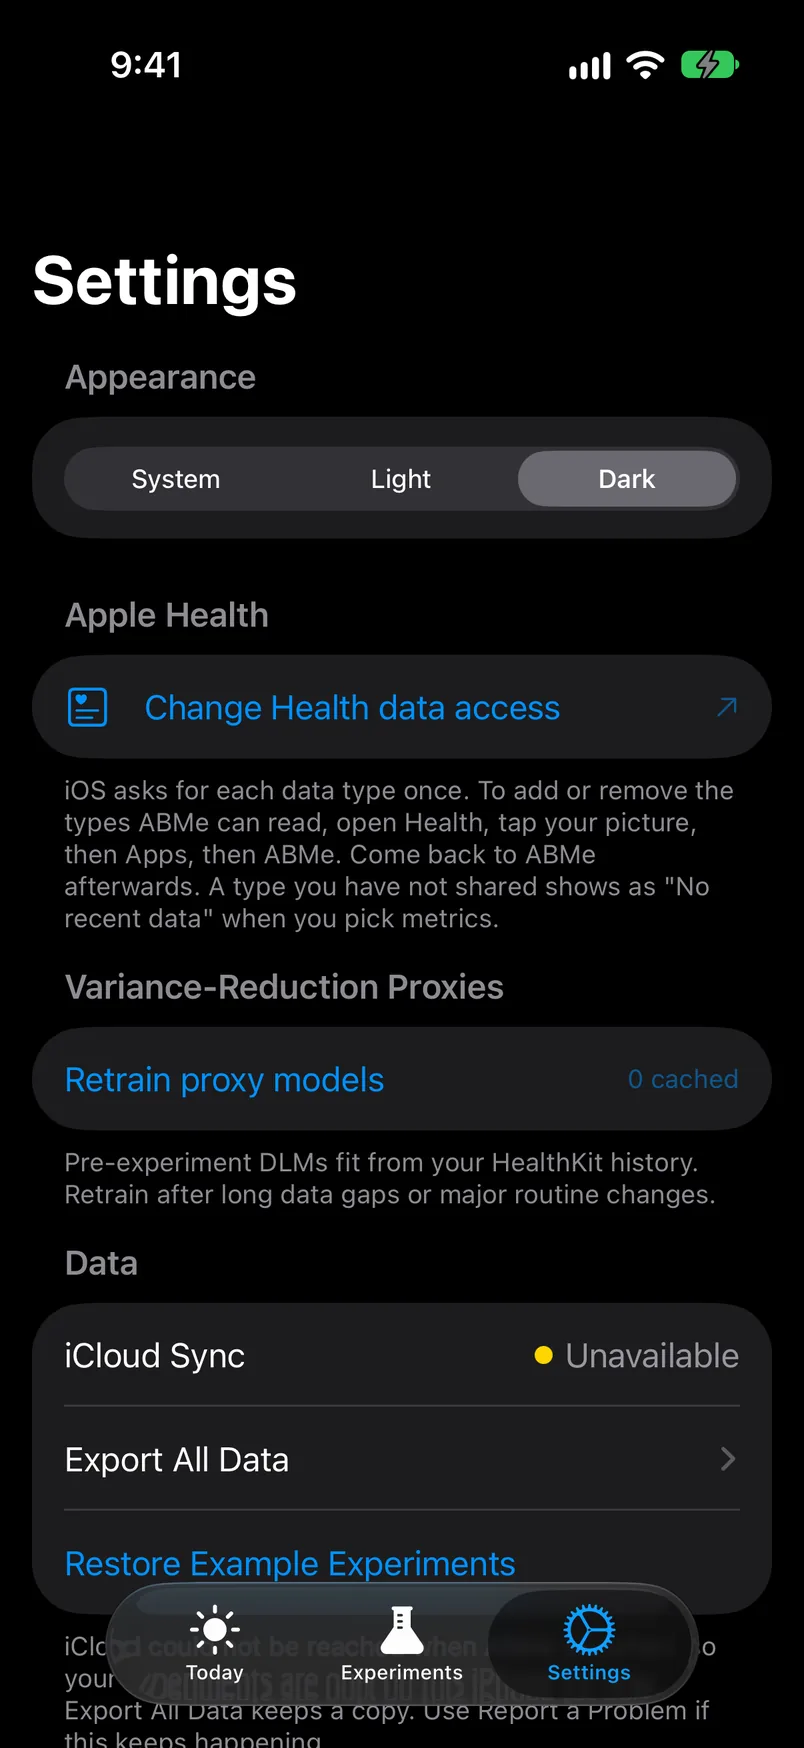
- 1Apple Health. iOS asks for each data type once. To add or remove the types ABMe can read, this row opens the Health app; the change takes effect when you come back.
- 2Retrain proxy models. Refits the forecasting models from your Health history for future experiments. Running experiments keep the models they started with.
- 3iCloud Sync. On, Off, Checking or Unavailable, with the last sync time, and a footer saying what to do about it. Experiments live in your private iCloud database and come back if you reinstall or add an iPad. Nobody else can read that database.
- 4Export All Data. Every experiment as CSV files, one row per unit and metric with the assignment, the window and the value, for R, Python or a spreadsheet.
- 5Restore Example Experiments. Reloads the six worked examples with their synthetic data, for exploring the Analysis and Data tabs before you have results of your own.
Above these, Appearance switches the app between System, Light and Dark.
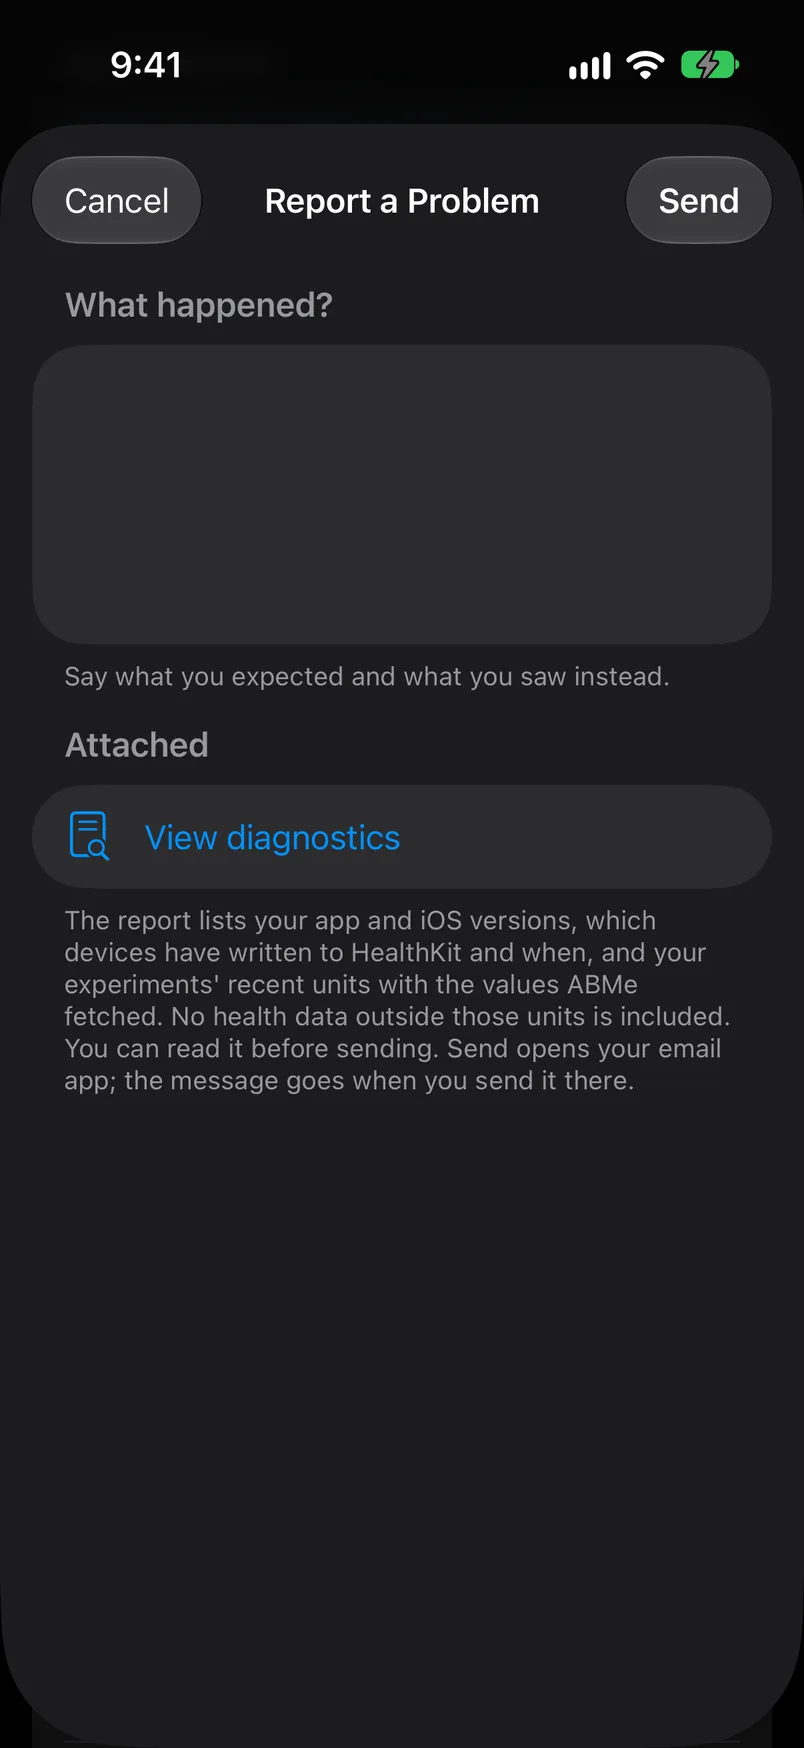 1
2
- 1What happened. What you expected and what you saw instead. Send opens your email app with the message addressed to support; it goes when you send it there.
- 2The diagnostics report. App and iOS versions, which devices have written to Apple Health and when, and your experiments' recent units with the values ABMe fetched. No Health data outside those units is included, and you can read the whole report before sending.
Glossary
- Unit
- The thing that is randomized and over which one result per metric is measured: a night, a day, a workout, a session or a block of calendar days.
- Treatment, control
- The two arms of the experiment. Blue and orange throughout the app.
- Randomize
- The tap that starts a unit by drawing its condition from a seeded fair coin.
- Metric
- An Apple Health type together with one fixed aggregation (average, sum or maximum over the unit), or a value you enter yourself.
- Primary metric
- The metric shown on the Today card and the result card. It is analysed like every other.
- Device
- The one Apple Health source a metric is read from for the whole experiment.
- Washout
- An optional gap between units so a treatment can clear before the next coin flip.
- Average treatment effect
- The mean over the units run so far of the treatment outcome minus the control outcome. The number the app estimates.
- Confidence sequence
- A sequence of intervals valid at every time simultaneously, so it can be checked after every unit and stopped on at will.
- Anytime-valid
- The property that the error probability is controlled over all stopping times, not just one fixed one.
- Regression adjustment
- Subtracting a pre-unit forecast from each outcome before weighting, to reduce variance without affecting validity.
- Forecast
- The one-step-ahead prediction of a metric from a local-level model fitted to your pre-experiment history.
- e-value
- A measure of evidence against a zero effect whose expectation under no effect is at most one. Used by the e-BY correction.
- False coverage rate
- The expected share of reported intervals that miss their true value. The quantity e-BY controls.
- Data-ready time
- When ABMe expects a unit's measurements to have reached Apple Health, and reads them.